   color         y
0   azul -4.333333
1  negro  2.000000
2   rojo  3.500000
It’s not advisable because: * You’ll have to manually rename the column names, which keep the name of the original column and not of the applied function. * You can’t apply the method to more than one function and column simultaneously * You can’t use any function, only some well-known ones.
Another method that can be used, but isn’t as convenient, is to use agg:
df_g = df.groupby("color").agg( {"x": [lambda _: _.mean()], # applied to y"y": [lambda _: _.nunique(), lambda _: _.mean()], # applied to z })print(df_g)
              x          y
       <lambda> <lambda_0> <lambda_1>
color
azul  -2.666667          2  -4.333333
negro  2.000000          3   2.000000
rojo  -3.500000          2   3.500000
It’s not advisable because: * It generates 2 levels of columns: it’s hard to “flatten” * It makes renaming the columns even harder. But at least it’s better than the previous method because you can use generic functions.
Suggested method
The method I recommend is agg but with explicit definition of the column names.
After the groupby, you apply the agg method by passing it an invented name for the desired parameter and giving it a tuple (column, function) as the value.
The generated columns immediately get the desired name!
The groupby can receive a list of columns in case you need a more detailed level of aggregation.
Note that the columns to be generated are passed as function parameters (promedio_y) and not strings ("promedio_y")!!!
Multicolumn
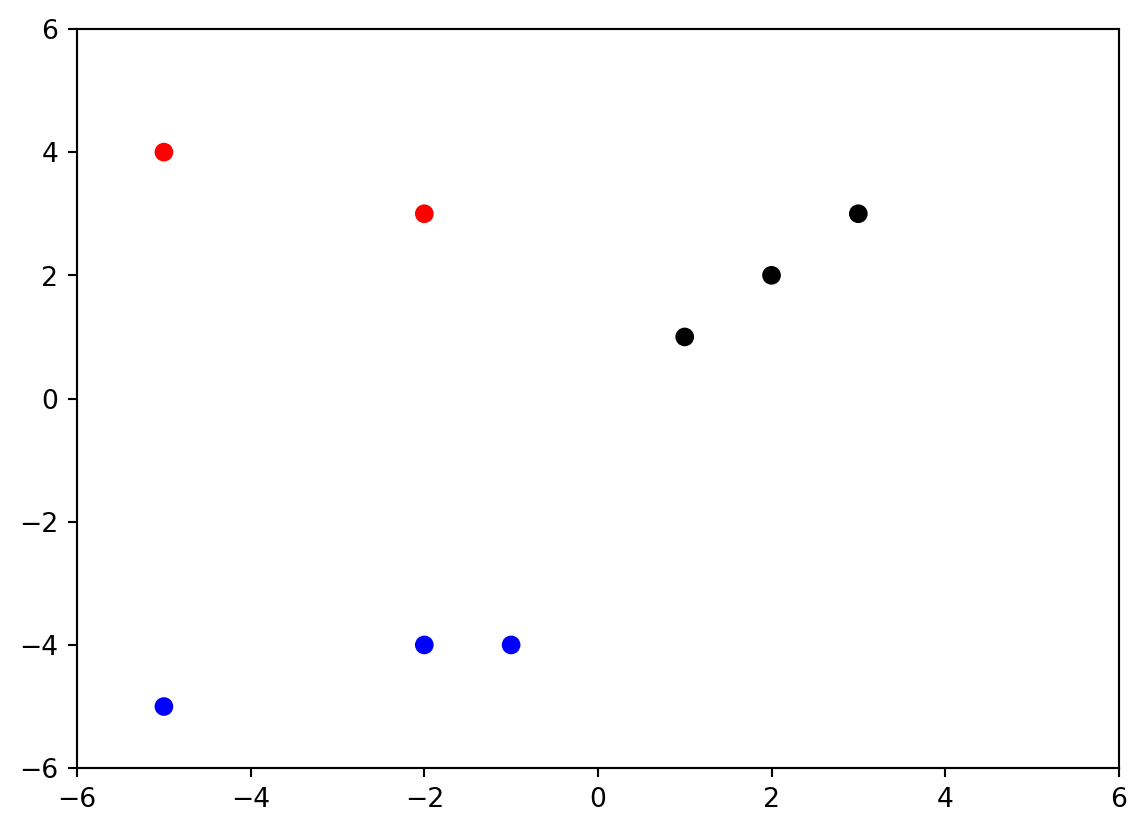
An interesting improvement is to use the above to work with multiple columns at the same time. Let’s look at a concrete example: calculating different metrics (distances) with respect to the origin (0,0).
To be able to apply the previous trick, we need to “pack the columns” into a variable
And now we can apply different functions, although in general it will be better to define them as functions (rather than lambda functions) to better express the relationships to use between the elements: